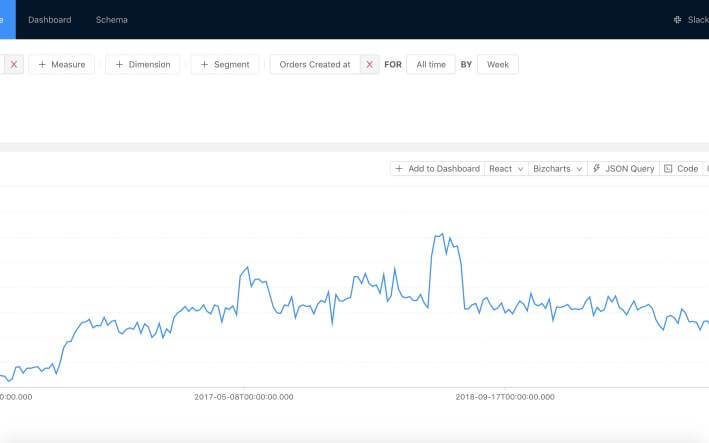
I've already covered building a static dashboard with Cube.js and Chart.js in this tutorial. Now, I’m going to show you how to dynamically change the underlying chart’s data based on the user’s input. We’ll let the user pick a date range and, based on that, reload the chart.