We think you might be interested in this job:
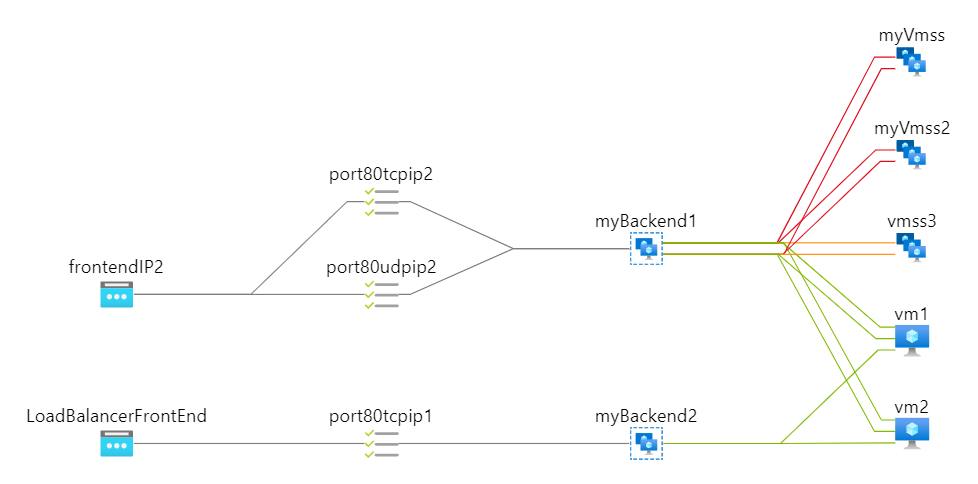
Built as part of Azure Monitor for Networks, customers now have topological maps for all their Load Balancer configurations and health dashboards for their Standard Load Balancers preconfigured with relevant metrics.
You can access this through the Insights blade of each Load Balancer resource and Azure Monitor for Networks, a central hub that provides access to health and connectivity monitoring for all your network resources.
For Standard Load Balancers, your backend pool resources are color-coded with Health Probe status empowering you to visualize the current availability of your network to serve traffic.
Through the Frontend and Backend availability tabs, you are provided with a breakdown of your Load Balancer and backend pool health status over time.
With all your network resource metrics in a single place, you can quickly filter by type, subscription, and keyword to view the health, connectivity, and alert status of all your Azure network resources such as Azure Firewalls, ExpressRoute, and Application Gateways.