CrowdSec is an open-source & collaborative security solution designed by SecOps for DevOps to secure most of your IT Linux assets: servers, containers, VMs, applications, services, sites. Its access is free and the source code can be found on GitHub.
The solution leverages a log-based behavior analysis engine to assess whether a hacker is trying to get into your systems. If the CrowdSec agent detects an aggression, the offending IP is blocked and sent for curation. If this signal passes the curation process, the IP is then redistributed across the whole user community so they are also protected against this IP. The ambition of the founding team is to build a crowd of white hats who collaborate while creating a real-time IP reputation database.
Collections: a set of configurations that allow CrowdSec to protect the given service. For example, the crowdsecurity/SSHD collection includes a parser for SSHD logs and a scenario to detect SSH bruteforce and SSH user enumeration.
Scenarios: a bundle of parsers and scenarios.
Bouncers: standalone software pieces in charge of blocking IPs
Since the release of CrowdSec v1.1.x a few weeks ago, CrowdSec now distributes more packages to its users: Debian and Ubuntu including Bionic, Bullseye, Buster, Focal, Stretch, Focal for x86-64 and arm, Red Hat Enterprise Linux (RHEL), CentOS and Amazon Linux.
CrowdSec can act as a syslog server since the data acquisition process has been completely updated, now supporting CloudWatch sources. And more will come!
How-to guide
Here is a tutorial for you to make the most of CrowdSec 1.1.x. The original article has been published by CrowdSec on their corporate blog. It can be found here.
CrowdSec setup
Prerequisites
For this tutorial, we need to install Apache2 to collect some logs.
CrowdSec will detect Apache2 and install the required collection.
If you install new services after this, you can update CrowdSec to install the required collections.
/usr/share/crowdsec/wizard.sh -c
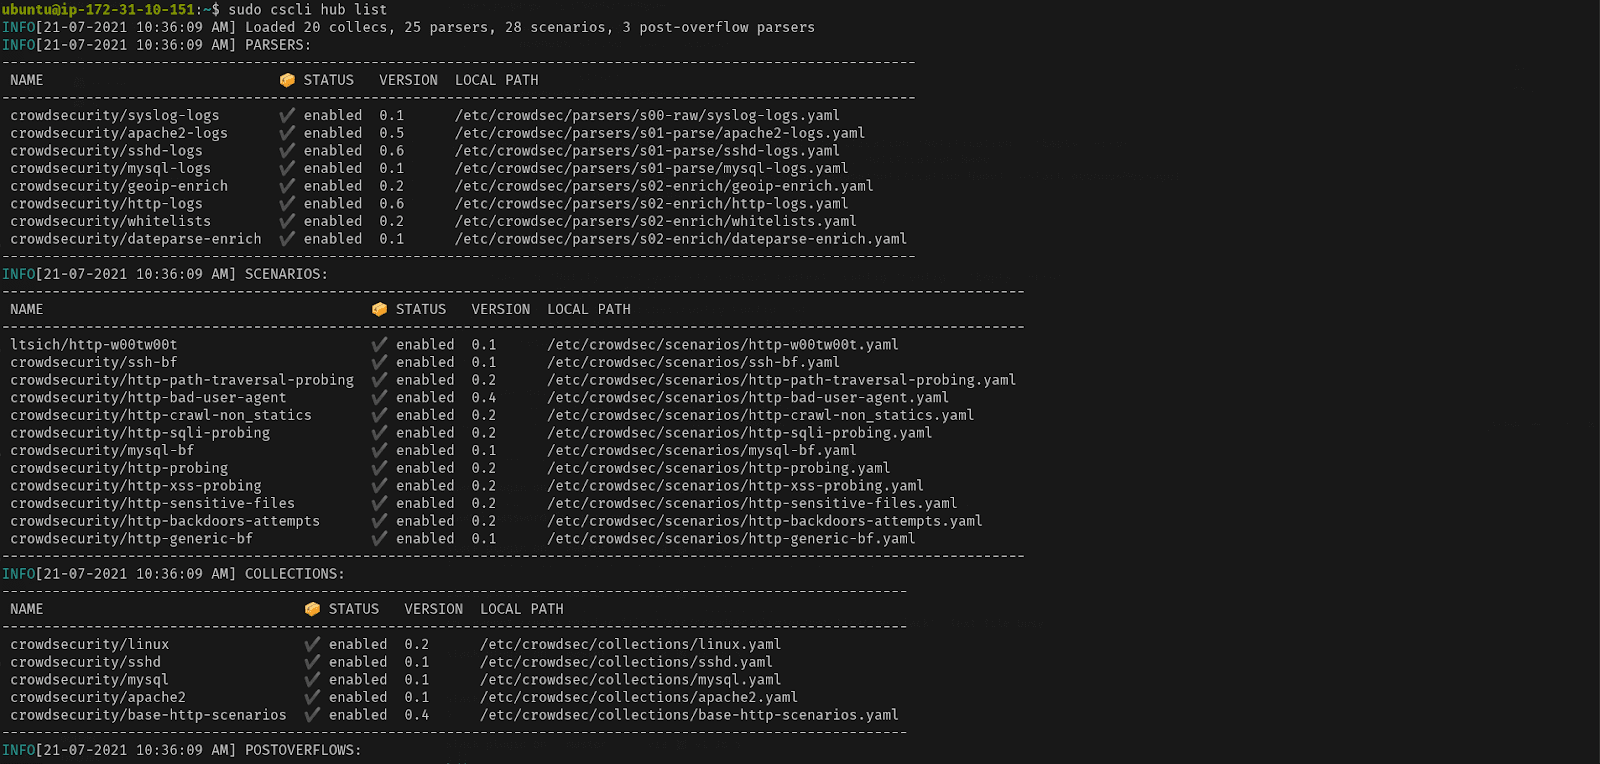
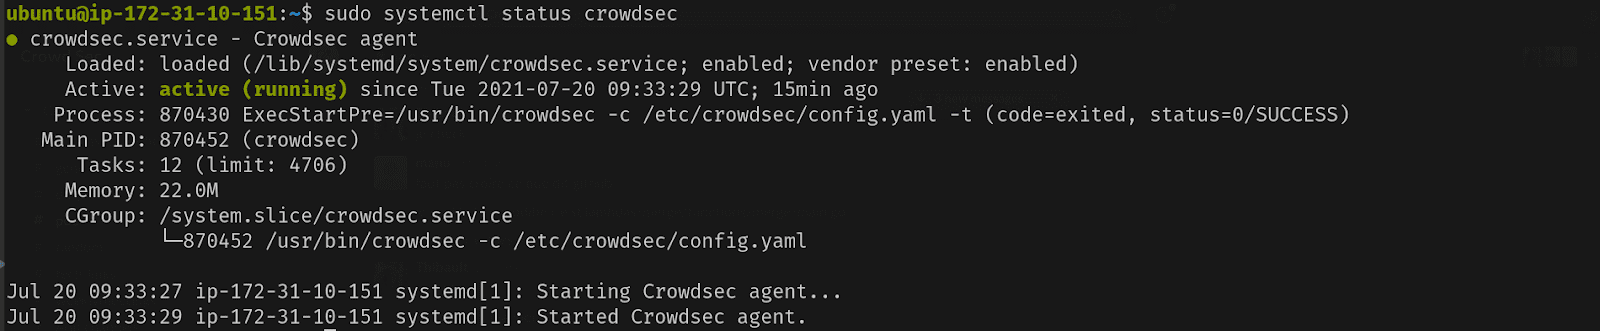
Double check your installation:
Detection capabilities
Now, let’s simulate a web application vulnerability scan on our Apache service using Wapiti, a web application vulnerability scanner. You will need to do this from an external IP, while bearing in mind that private IPs are whitelisted by default.
On our freshly equipped machine, we can see the attacks in the logs:
Don’t forget that the website we attacked here is an empty Apache server. In the case of a real website, the scanner would perform many other actions that would lead to more detections.
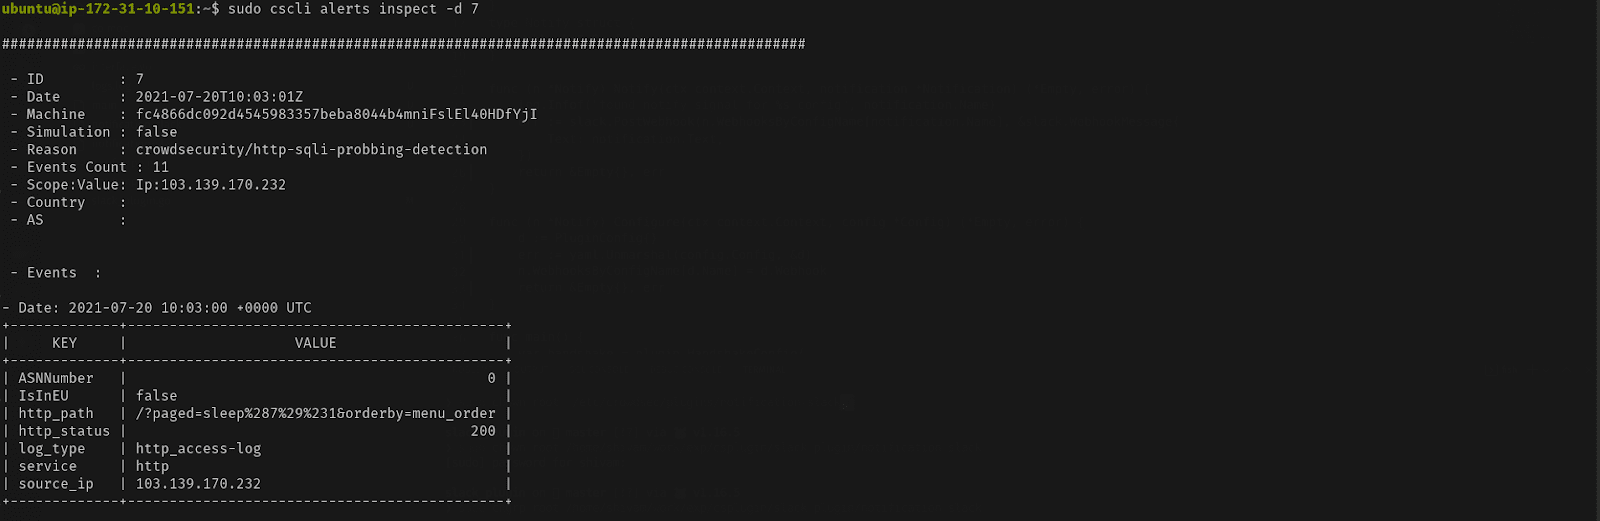
Checking the results in cscli
Cscli is one of the main tools for interacting with the CrowdSec service, and one of its features, among many others to interact and inspect the CrowdSec service, is visualizing active decisions and past alerts.
Defend attacks with bouncers
CrowdSec’s detection capabilities provide observability on what is going on. However, to protect yourself, you need to block attackers, which is where bouncers play a major part. Remember: CrowdSec detects, bouncers deter.
Bouncers work by querying CrowdSec’s API to know when to block an IP. You can download them directly from the CrowdSec Hub.
In this example, let’s use the cs-firewall-bouncer. It directly bans any malevolent IP at the firewall level using iptables or nftable. We’ll be using nftable.
Installing the bouncer
Cs-firewall-bouncer is available in the CrowdSec repositories we added before.
Check whether the bouncer is registered properly with CrowdSec:
Testing the bouncer
Warning: Before going further, ensure you have another available IP to access your machine so that you don’t ban yourself. Using your smartphone’s internet connection will work. Now that you have a bouncer to protect yourself, try the test again.
Run the Wapiti scanner like before via:
ATTACKER$ wapiti -u http://34.248.33.108/
After the scan is complete check accessing the server, from the attacker’s machine:
curl: (28) Connection timed out after 1000 milliseconds
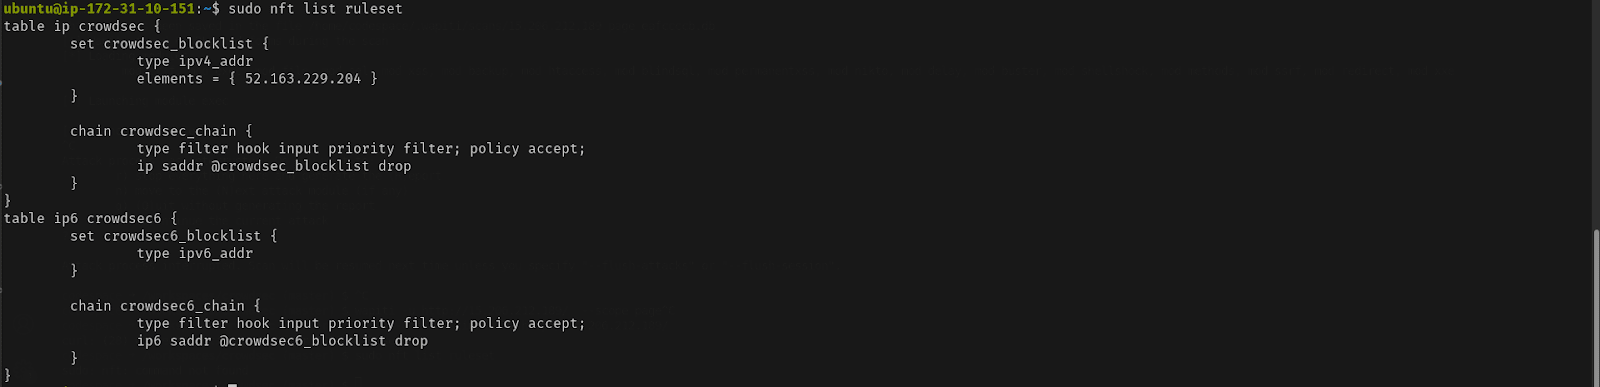
For the technically curious, the cs-firewall-bouncer uses either nftables or iptables. Using nftables (used on Debian 10 by default) creates and maintains two tables named crowdsec and crowdsec6 (for IPv4 and IPv6 respectively).
You can change the firewall backend used by the bouncer in /etc/crowdsec/bouncers/crowdsec-firewall-bouncer.yaml by changing the mode from nftables to iptables (ipset is required for iptables mode).
Observability
Observability (especially for software that might take defensive countermeasures) is always a key point for a security solution. Besides its “tail the logfile” capability, CrowdSec offers two ways to achieve this: Metabase dashboards, and Prometheus metrics.
Using Metabase
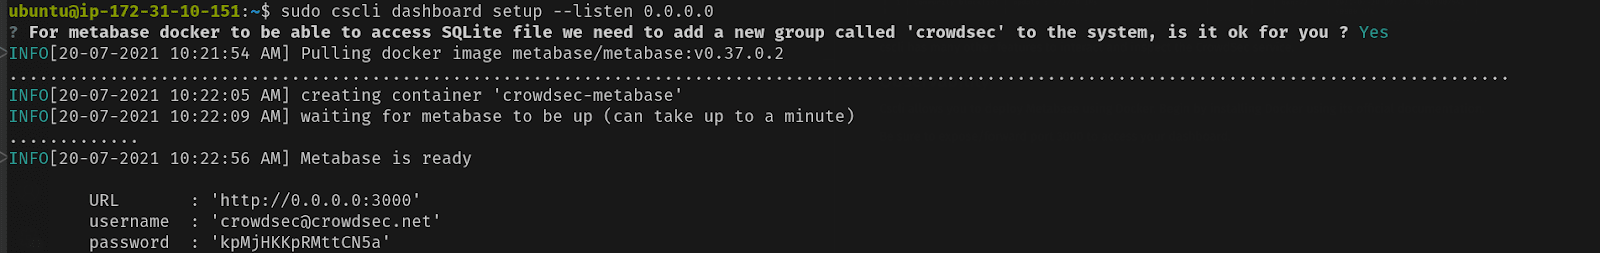
Cscli allows you to deploy Metabase using Docker. Begin by installing Docker using its official documentation. Be sure to expose/forward port 3000 to access your dashboard.
You can now log in to Metabase using the generated credentials.
Prometheus metrics
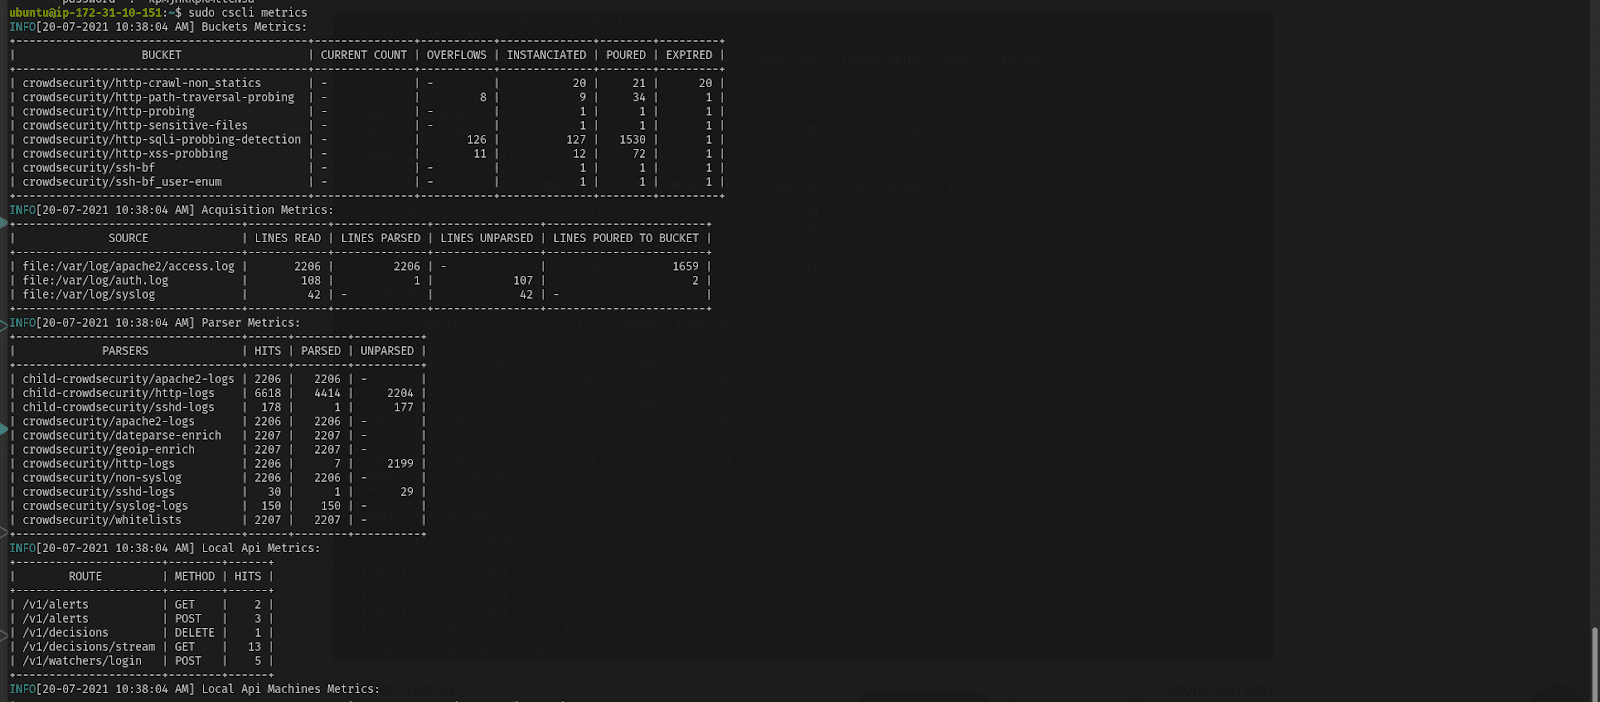
While some people love visual dashboards, others prefer different kinds of metrics. This is where CrowdSec’s Prometheus integration comes into play. One way to visualize these metrics is with cscli metrics:
The cscli metrics command exposes only a subset of Prometheus metrics that are important for system administrators. You can find a detailed description of the metrics in the documentation.
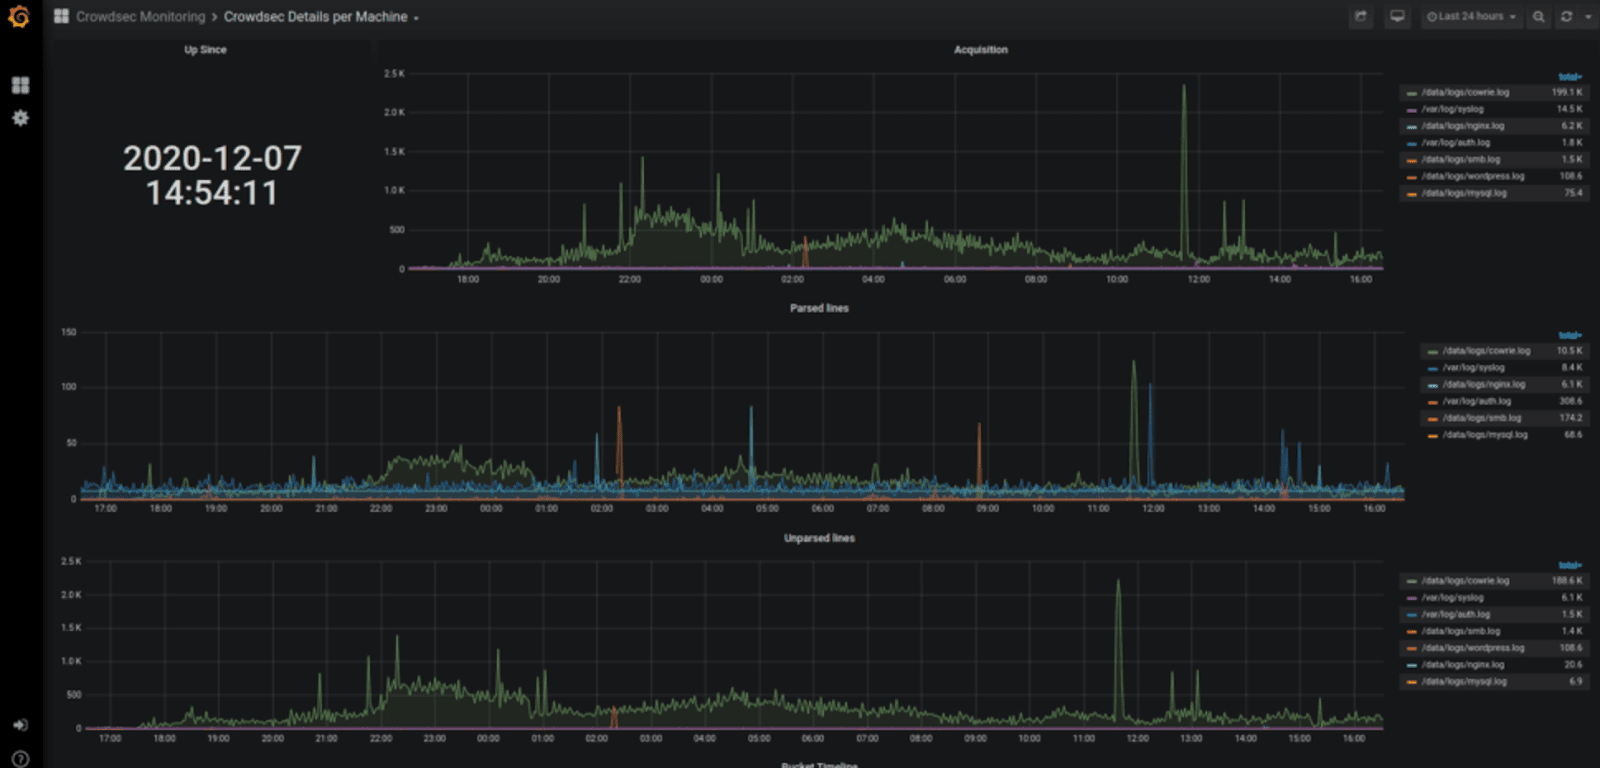
Viewing Crowdsec’s Prometheus metrics via cscli metrics is more convenient but doesn’t do justice to Prometheus. It is out of scope for this article to deep dive into Prometheus, but these screenshots offer a quick look at what CrowdSec’s Prometheus metrics look like in Grafana.
Enrolling to the CrowdSec Console
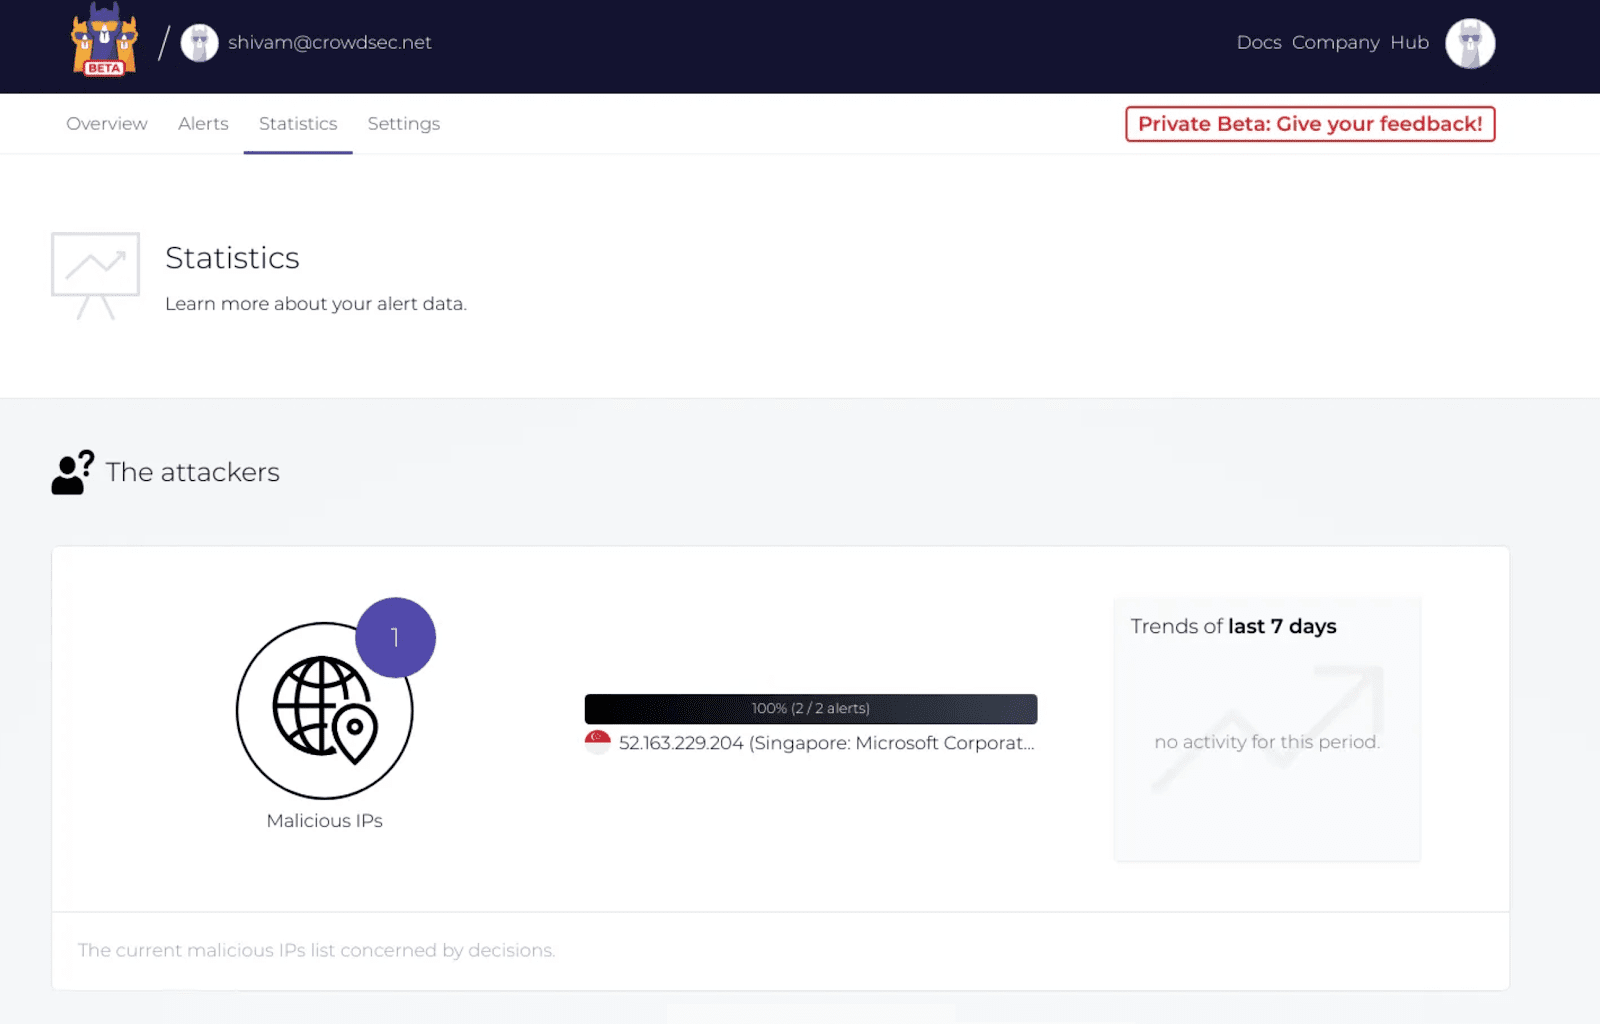
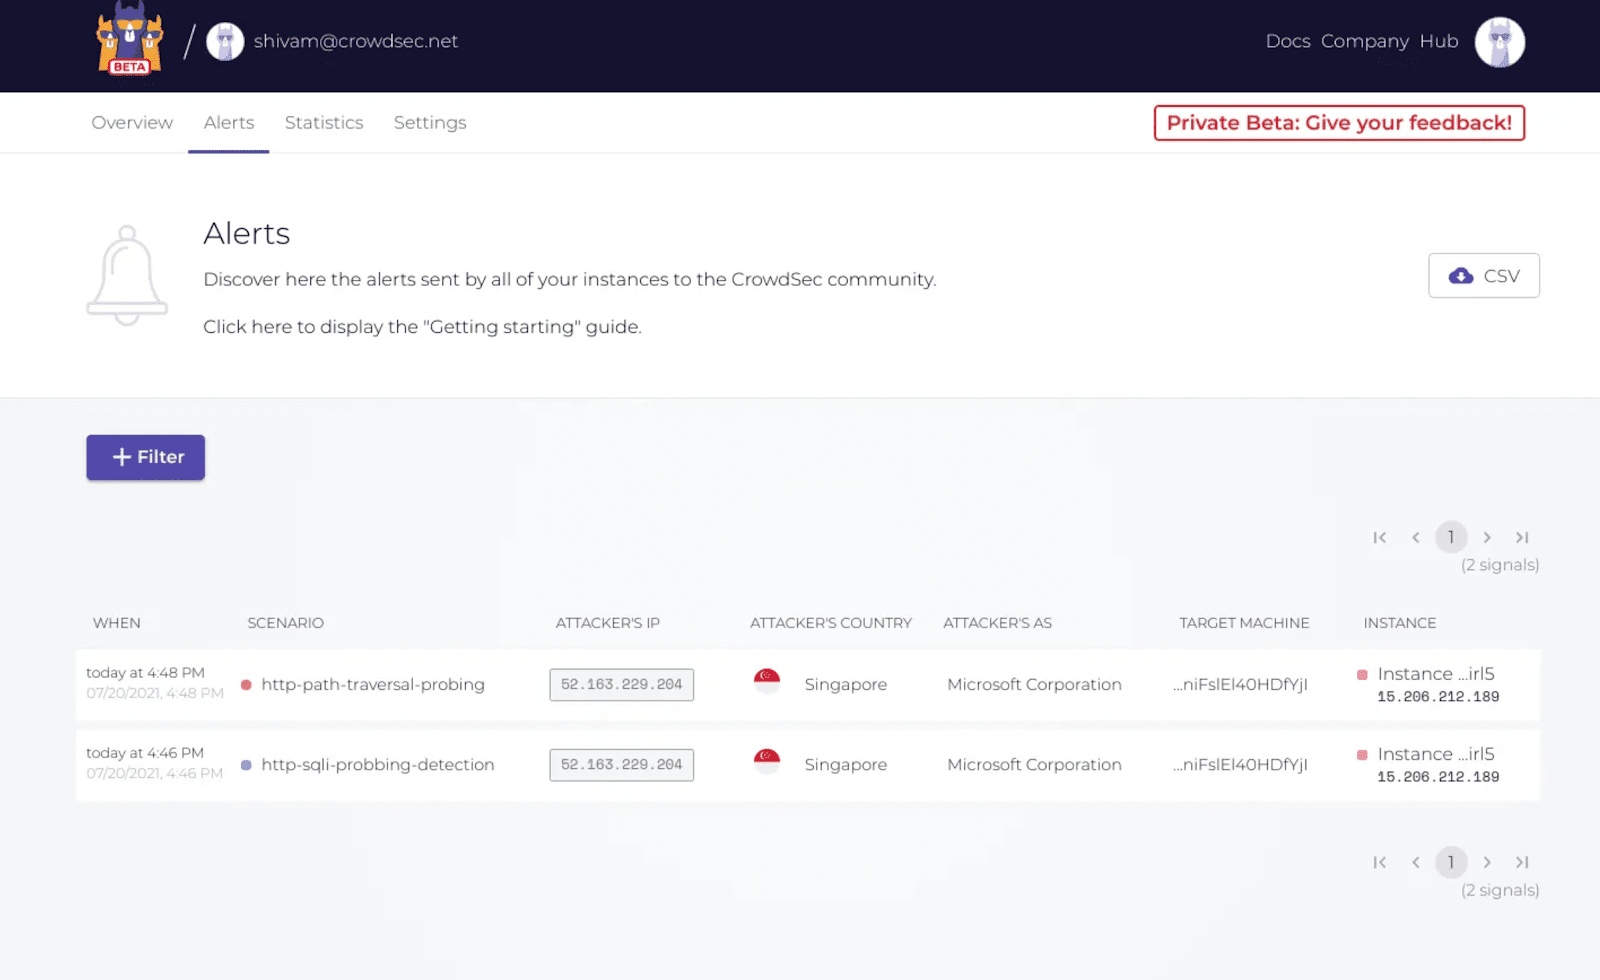
The console provides an easy-to-use web interface to inspect multiple CrowdSec agents spread across different networks.
To test it, create a console account. After signing in, follow the instructions to enroll the CrowdSec agent. After the initial synchronization, you can view alerts and related statistics in the web interface.
Get involved
We would love to hear your feedback about this latest release. If you are interested in testing the software or would like to get in touch with the team, drop by our Gitter channel.